Combatting the Urban Heat Island Effect with UAV Thermal Imaging – Part 4
Quantifying Thermal Surface Area within the Urban Environment
Urban design-informing data has been the most powerful result of my UAV thermal research. It is an industry-first and recalibrating the way we approach the urban environment for 21st century life.
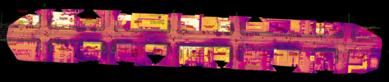
As outlined in Part 1, SmithGroup’s UAV arsenal is capable of scanning sites within 1cm of accuracy on the X, Y and Z axes, while post-processing software can export georeferenced thermal orthomosaics across the entire spectrum of industry-standard file formats. An added benefit of the streetscape project corridor was that its underlying professionally prepared topographic survey was available to reference. I was able to effectively bridge the survey vectors and thermal scan within AutoCAD Civil3D model space. These independently prepared files overlaid precisely within the world coordinate system and allowed me to dissect the project’s existing conditions from a highly accurate basis for performance metrics.
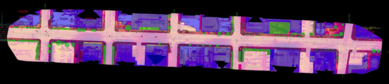
Combining vector files allowed for extremely detailed analysis to benchmark future comparisons, but also presented a transect inventory of the greater urban context’s existing: material performance, surface area and dimensional / spatial relationships as measured in situ through a hi-res thermal lens.
In other words, we reach the groundbreaking opportunity to conduct both pre- and post-occupancy thermal site evaluations, but also deduce valid physical determinations about exactly what is causing the urban heat island effect, and exactly what can be done to help cities mitigate it. As the medical practitioner checks a patient’s vitals by taking temperature, we can accomplish the same for a city in order to provide appropriate treatment options.
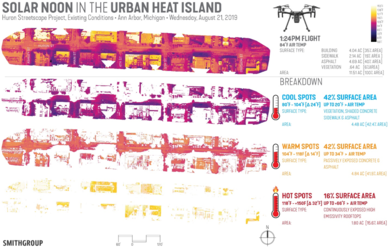
The graphic above is a vivid breakdown of the urban environment at its most exposed: solar noon. In my experience the project corridor’s existing conditions and layout pattern are relatively common across Midwestern cities, drawing broader regional implications from its findings. The biggest takeaways:
- Nearly 60% of the city is >20°F warmer than the 84°F air temperature. What? Is this real life? That means nearly 60% of this typical urban corridor measured a minimum of 104°F or more, despite a measured air temperature of 84°F. And nearly 3% of that surface area measured 150°F – that’s sous vide!
- Bitumen rooftops are kind of terrible. Sure they conventionally perform as a roof, but they are everywhere and are truly an environmental burden. Roughly 2 acres, or about 16% of the corridor surface area, measured between 118°F and upwards of 150°F. Most of the surface area within this temperature range was comprised of building rooftops.
- Los Angeles painted their streets white for a reason. Approximately 42% of the Ann Arbor streetscape corridor measured 20°F - 34°F warmer than the 84°F air temperature. Nearly all the surface area within this temperature range was comprised of asphalt roads and concrete sidewalk. Imagine being able to drop temperatures by roughly 30°F in nearly half a city by applying what is essentially a reflective seal coat. Los Angeles did exactly that to much media speculation and criticism, but it feels fairly pragmatic under a thermal lens. Rebuilding streetscapes from scratch in order to reduce the urban heat island effect at scale could be resource prohibitive, but even just targeted creative treatments to retrofit existing infrastructure can accomplish a lot.
At SmithGroup we are actively scanning the urban realm and our projects to see how they can better perform to help cities holistically mitigate the urban heat island effect. We have applied this data and are recalibrating contemporary urban design for a more habitable, more sustainable future.
This is the fourth installment of what will continue to unfold in coming months and years as data and forthcoming analyses reveal more. The fifth installment will dissect and inventory the thermal material palette of the urban environment. Want to see more? Follow SmithGroup on LinkedIn and Twitter to be part of the conversation.